Researchers often use melt curve analysis to assess whether their intercalating dye PCR/qPCR assays have produced single products. Specificity of amplification is considered to be a greater concern with intercalating dye assays than with probe-based assays because intercalating dyes bind to any double-stranded DNA product and are not sequence specific. With probe-based assays, amplicon specific primers gain an additional level of specificity from the probe, which is a third sequence that has to bind within the amplicon of the target sequence in order to generate a fluorescent signal.
Melt curve analysis is frequently used as a tool for assessing qPCR amplicon length with intercalating dye qPCR assays. Here, we explain how melt curves are produced, examine the assumptions being used, and describe some additional methods that can be used to further analyze melt curve results.
One peak = one amplicon, or does it?
Figure 1 shows the melt curves for 2 different amplicons. The single peak observed for an amplicon from exon 17b of CFTR (Figure 1A) is typically interpreted as representing a pure, single amplicon. In contrast, the melt curve for an amplicon from exon 7 of CFTR (Figure 1B) shows 2 peaks, a result which is usually interpreted as being indicative of 2 separate amplicons.

Melt curves from qPCR of CFTR gene. (A) An amplicon from CFTR exon 17b reveals a single peak following melt curve analysis, while (B) an amplicon from exon 7 produces 2 peaks, is often interpreted as representing multiple amplicons, when in this case, there is only one amplicon generated (Figure 2B).
In fact, follow up analysis by gel electrophoresis shown in Figure 2, reveals that both of these curves generate a single amplicon, confirming that a single PCR product was obtained. To explain these apparently conflicting results, we need to examine how the melt curves are produced.
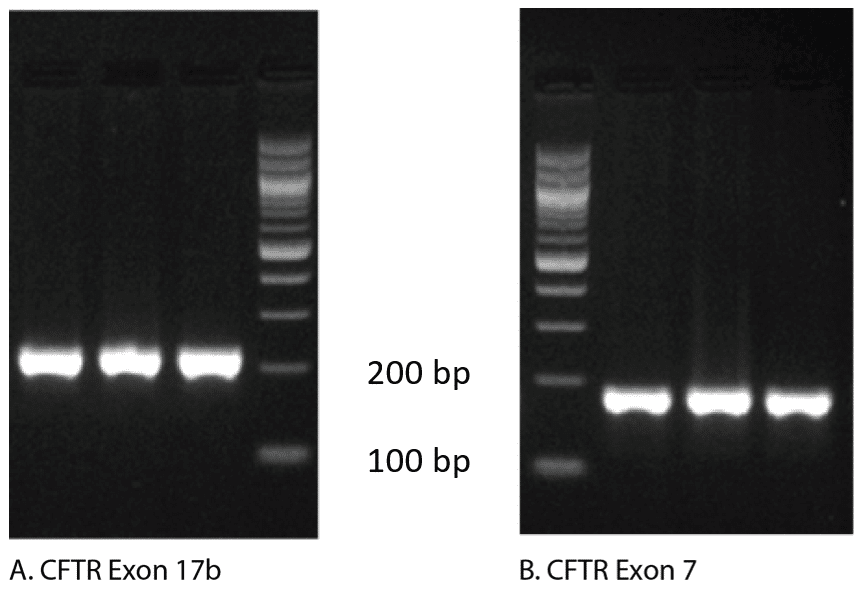
Agarose gel electrophoresis of qPCR products show single amplicons. Analysis of qPCR amplicons on an agarose gel stained with ethidium bromide shows a single band for both (A) exon 17b and (B) exon 7 of the CFTR gene.
How are melt curves produced?
The intercalating dyes used in qPCR fluoresce only when they are bound to double-stranded DNA (dsDNA). They do not fluoresce in the presence of single-stranded DNA (ssDNA), or when the dyes are free in solution.
Typically, the thermal cycler being used to run the qPCR is programmed to produce the melt curve after the amplification cycles are completed. At the end of the qPCR run, the thermal cycler starts at a preset temperature (usually above the primer Tm, e.g., 65°C) and measures the amount of fluorescence.
The temperature of the sample is then increased incrementally as the instrument continues to measure fluorescence. As the temperature increases, dsDNA denatures becoming single-stranded, and the dye dissociates, resulting in decreasing fluorescence (Figure 3).
The change in fluorescence is then plotted as a function of temperature to obtain the melt curve for CFTR exon 17b (Figure 1A). Interpretation of this curve is based on the assumption that the amplicon is in 1 of 2 basic states, double-stranded or single-stranded, i.e., when the dsDNA starts to melt, it quickly falls apart with no intermediate state. This is often observed, and so allows for a simple, general rule. However, if we apply this rule to the melt curve for CFTR exon 7 (Figure 1B), the 2 peaks would be interpreted as the melting events of 2 different amplicons. But we know that the amplicon from CFTR exon 7 is a single DNA product (Figure 2B). So how do we align these 2 conflicting ideas?

Dissociation curve of CFTR exon 17b amplicon. Change in fluorescence with increasing temperature is measured. As the temperature is increased, the 2 strands of the amplicon separate to form single-stranded DNA, causing the fluorescent intercalating dye to dissociate from the DNA and stop fluorescing.
DNA melting is a multi-state process
The assumption that DNA melting is based on a 2-state event (dsDNA and ssDNA) needs to be reassessed. If we allow for the possibility that the DNA may be assuming an intermediate state that is neither dsDNA or ssDNA and reexamine the raw data from the CFTR exon 7 melt experiment (Figure 4), it is possible to interpret the data in another way. As the dsDNA starts to melt, regions of the amplicon that are more stable (e.g., G/C rich) do not melt immediately. These stable regions maintain their dsDNA configuration until the temperature is sufficiently high to cause it to melt. This scenario results in 2 melting phases. The data in Figure 4 is consistent with this interpretation, which results in the curve shown in Figure 1B.
Additional sequence factors can also cause products to melt in multiple phases. These include amplicon misalignment in A/T rich regions, and designs that have secondary structure in the amplicon region.

Dissociation curve of CFTR exon 7 amplicon. The change in fluorescence as the temperature is increased from 65°C is measured. As the temperature increases, the 2 strands of the amplicon separate to form single-stranded DNA, causing the fluorescent intercalating dye to dissociate from the DNA and stop fluorescing. The shoulder in the curve between 80°C and 85°C suggests the presence of an intermediate state where the DNA is in both double-stranded and single-stranded configurations.
Alternative methods for amplicon analysis
Agarose gel analysis: The gold standard for analyzing the products of qPCR continues to be agarose gel visualization of a portion of the reaction. The presence of a single band indicates a single product (Figure 2).
uMelt℠: Alternatively, to reduce the number of gels needed to confirm the presence of a single amplicon, uMelt melting curve prediction software, a reliable, flexible, free online tool created at the University of Utah, can be used. This program predicts melt curves and their derivatives for qPCR-length amplicons and is ideally suited to test for multiple peaks in a single amplicon product.
uMelt can predict the shape of melting curves and the complicated melting transitions that occur during dissociation. Nearest-neighbor thermodynamics are used recursively to calculate the helicity of the amplicon at different temperatures through a very accessible and easy-to-use interface.
uMelt employs algorithms that have been peer-reviewed [1], and users can select from various design iterations, making the program increasingly popular. The simple interface comprises a textbox for entering the amplicon sequence, a pull-down menu for selecting the algorithm version by journal article, and a set of boxes to insert Na+, Mg2+, and DMSO concentrations (Figure 5).
Although most qPCR master mixes are proprietary, the scientists at University of Utah have found that the algorithm gives consistent curve shapes under a variety of conditions and with various master mixes. The main parameter that varies is the temperature at which the amplicon melts; the shape of the curve and the capacity to predict the number of peaks remain unchanged.

Figure 5. User interface for uMelt tool. User input locations on the simple interface are indicated (red oval and blue boxes).
Figure 6 shows a qPCR melt curve, an ethidium bromide-stained gel of the reaction product, and the uMelt predictions for the same amplicon (CFTR exon 13). The derivative of the melt curve predicted by uMelt closely matches the actual measurements taken by the thermal cycler.

Comparative analysis of CFTR exon 13 amplicons. Instrument-derived, agarose gel, and uMelt analyses of an amplicon generated from exon 13 of CFTR are compared. (A) The instrument-derived melt curve suggests the presence of 2 amplification products. (B) An ethidium bromide-stained agarose gel of the qPCR product shows a single band. (C) A predictive uMelt dissociation curve shows the slight changes associated with regions of different stability. (D) A derived melt curve from the dissociation curve in C shows how closely the uMelt prediction agrees with the actual melt curve obtained by the instrument (shown in A).
The predictive power of uMelt allows it to be used not only to determine whether an amplicon has a multi-phase melt curve, but also to forecast relative changes in the curve caused by sequence changes within the amplicon. This feature makes uMelt useful for applications such as high-resolution melt (HRM). HRM analysis of PCR products is increasingly being used to identify single nucleotide polymorphisms (SNPs). The uMelt program has the sensitivity to predict changes in melt characteristics due to a single base change. These predictions may be used in conjunction with gBlocks™ Gene Fragments controls to prepare samples for HRM analysis.
It takes more than a melt curve
The data presented show that although melt curve analysis can be used to confirm that a single amplicon has been generated by qPCR, the presence of a double peak is not always indicative of non-specific amplification. Other analysis tools, such as agarose gels and the uMelt melt curve prediction software, can be used in conjunction with instrument-generated melt curves to determine the purity of an amplicon.
Want to go deeper? Watch our webinar
In April 2015, IDT hosted a webinar, Understanding Melt Curves for Improved SYBR Green Assay Analysis and Troubleshooting, that covered several aspects of melt curve analysis. This webinar features our resident expert, Nick Downey, PhD, discussing some of the benefits and limitations of melt-curve analysis through clear examples and provides an overview of the uMelt software for guiding assay design.
Acknowledgements: We thank Dr Zach Dwight and Prof Carl Wittwer, Pathology Department, University of Utah, Salt Lake City, UT, USA, for collaboration in writing this article. Dr Dwight also provided the wet lab data for amplicon melt curves and gel electrophoresis.
References
- Dwight Z, Palais R, Wittwer CT. uMELT: prediction of high-resolution melting curves and dynamic melting profiles of PCR products in a rich web application. Bioinformatics. 2011;27(7):1019–1020.
- Huguet JM, Bizarro CV, Forns N, et al. Single-molecule derivation of salt dependent base-pair free energies in DNA. Proc Natl Acad Sci USA. 2010;107(35):15431–15436.
- Bruzzone CM, Tawadros PS, Boardman LA, et al. Enhanced primer selection and synthetic amplicon templates optimize high-resolution melting analysis of single-nucleotide polymorphisms in a large population. Genet Test Mol Biomarkers. 2013;17(9):675–680.
For research use only. Not for use in diagnostic procedures. Unless otherwise agreed to in writing, IDT does not intend for these products to be used in clinical applications and does not warrant their fitness or suitability for any clinical diagnostic use. Purchaser is solely responsible for all decisions regarding the use of these products and any associated regulatory or legal obligations.
RUO23-1698_001

